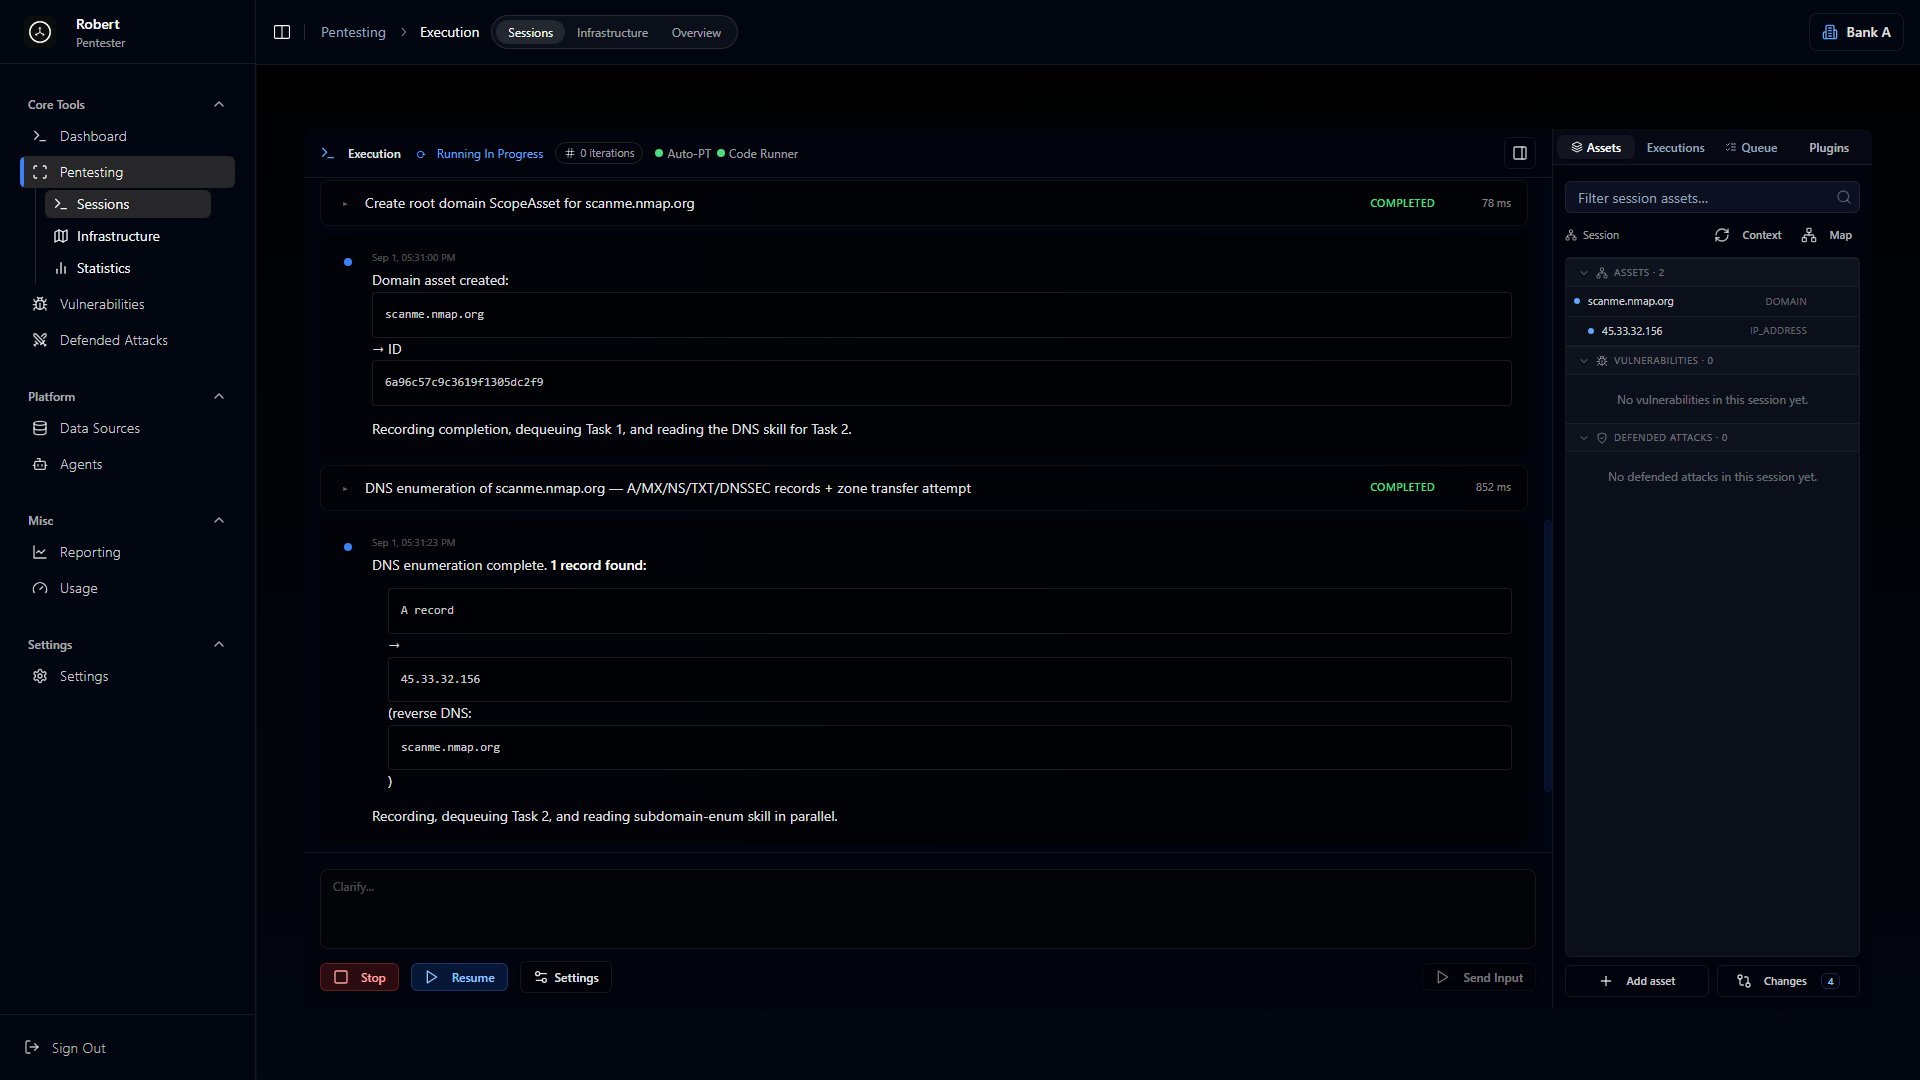

Pentesting
Every pentest begins here. Before you throw exploits at a target, you need to know what you’re working with: what’s exposed, how things connect, where the attack surface actually is. Skip this step and you’ll waste time testing the wrong things, or miss obvious entry points entirely. The best pentesters spend more time on recon than on exploitation. A well-mapped target often gives up vulnerabilities on its own - forgotten subdomains, exposed admin panels, services that were never meant to be public. The more complete your picture, the better your attacks. The Pentesting section is where you build that picture. It’s your home base for the “context”: the map of assets you’re testing, the vulnerabilities you’ve found, and the attacks that got blocked. As you run tests, it updates in real time. It’s also where you work with the IDE and AutoPT. Three subtabs live here: Sessions, Infrastructure, and Overview.Overview
High-level stats about your scope: total assets, how they break down by type, discovery trends over time, and the protection mechanisms found in the environment.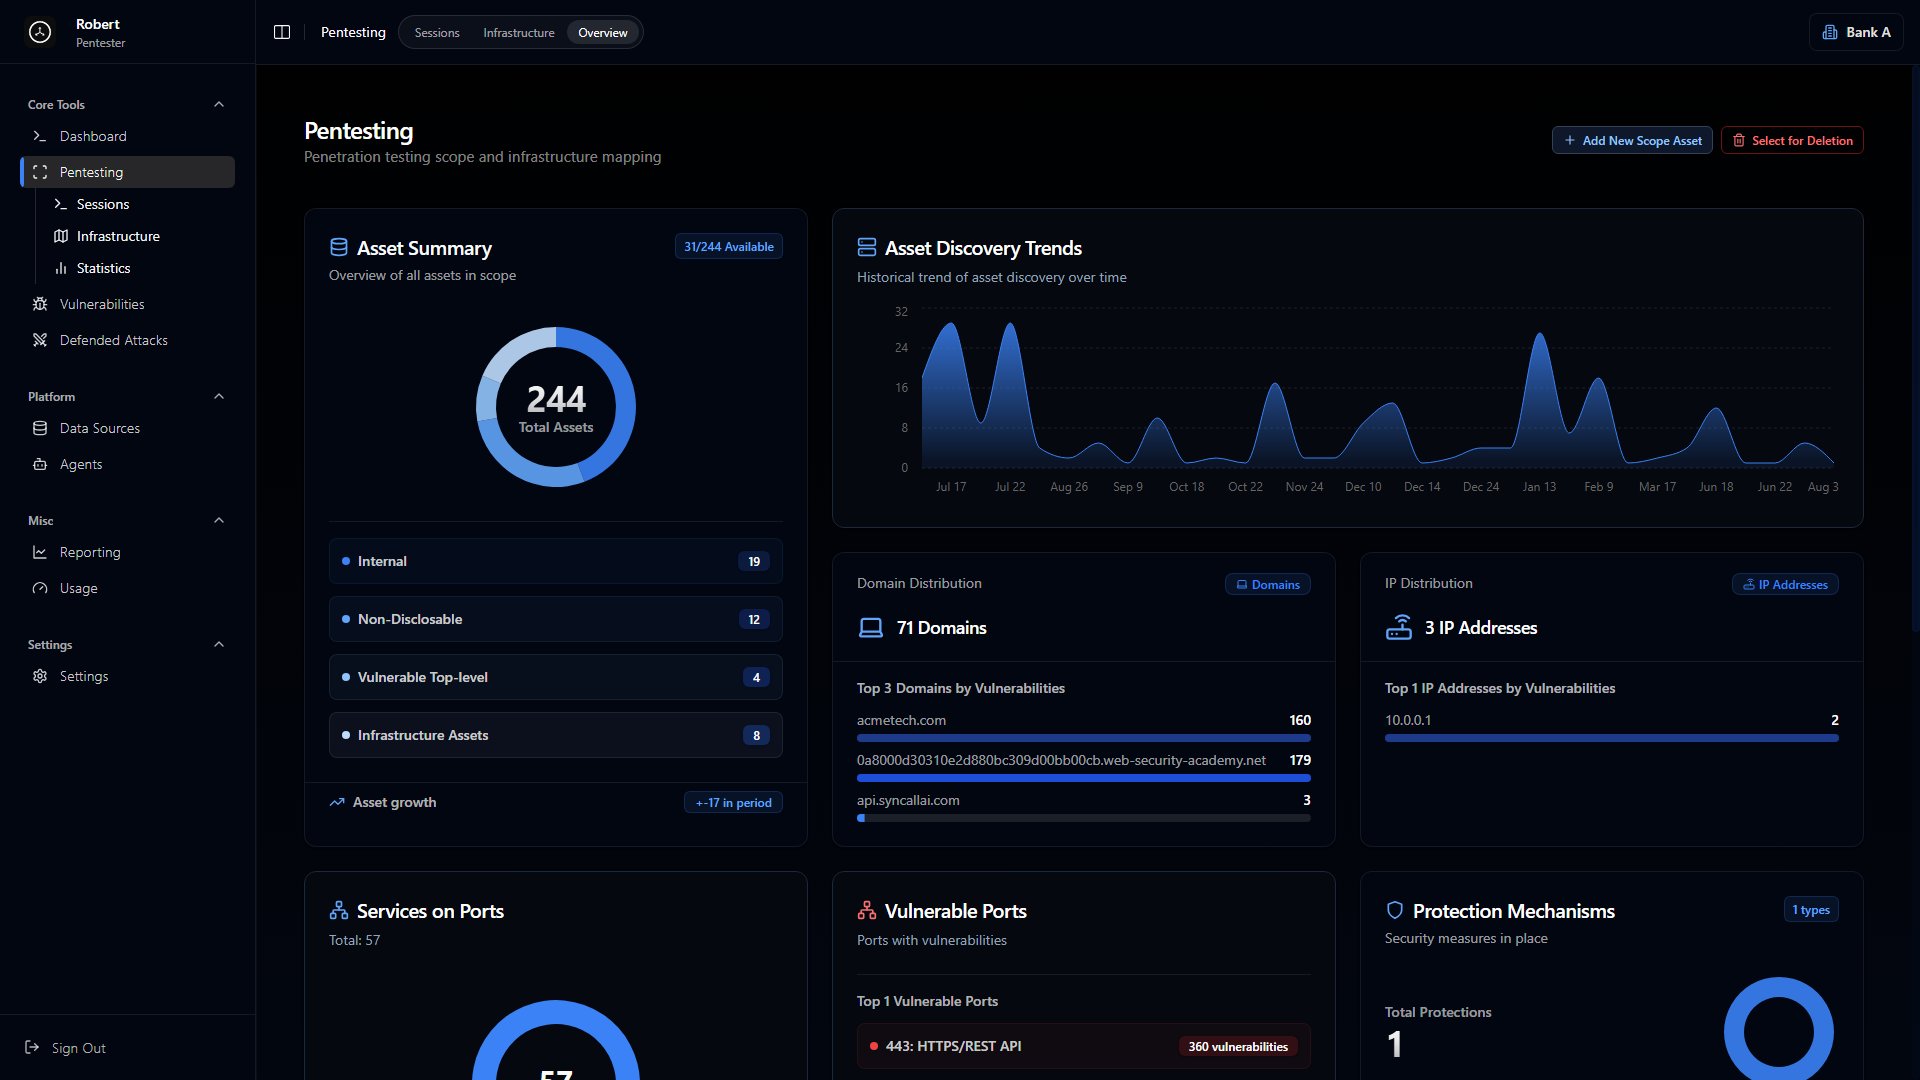
Infrastructure
The Infrastructure tab visualizes your targets and how they relate to each other. Assets that carry vulnerabilities are flagged, so you can see the shape of the attack surface at a glance.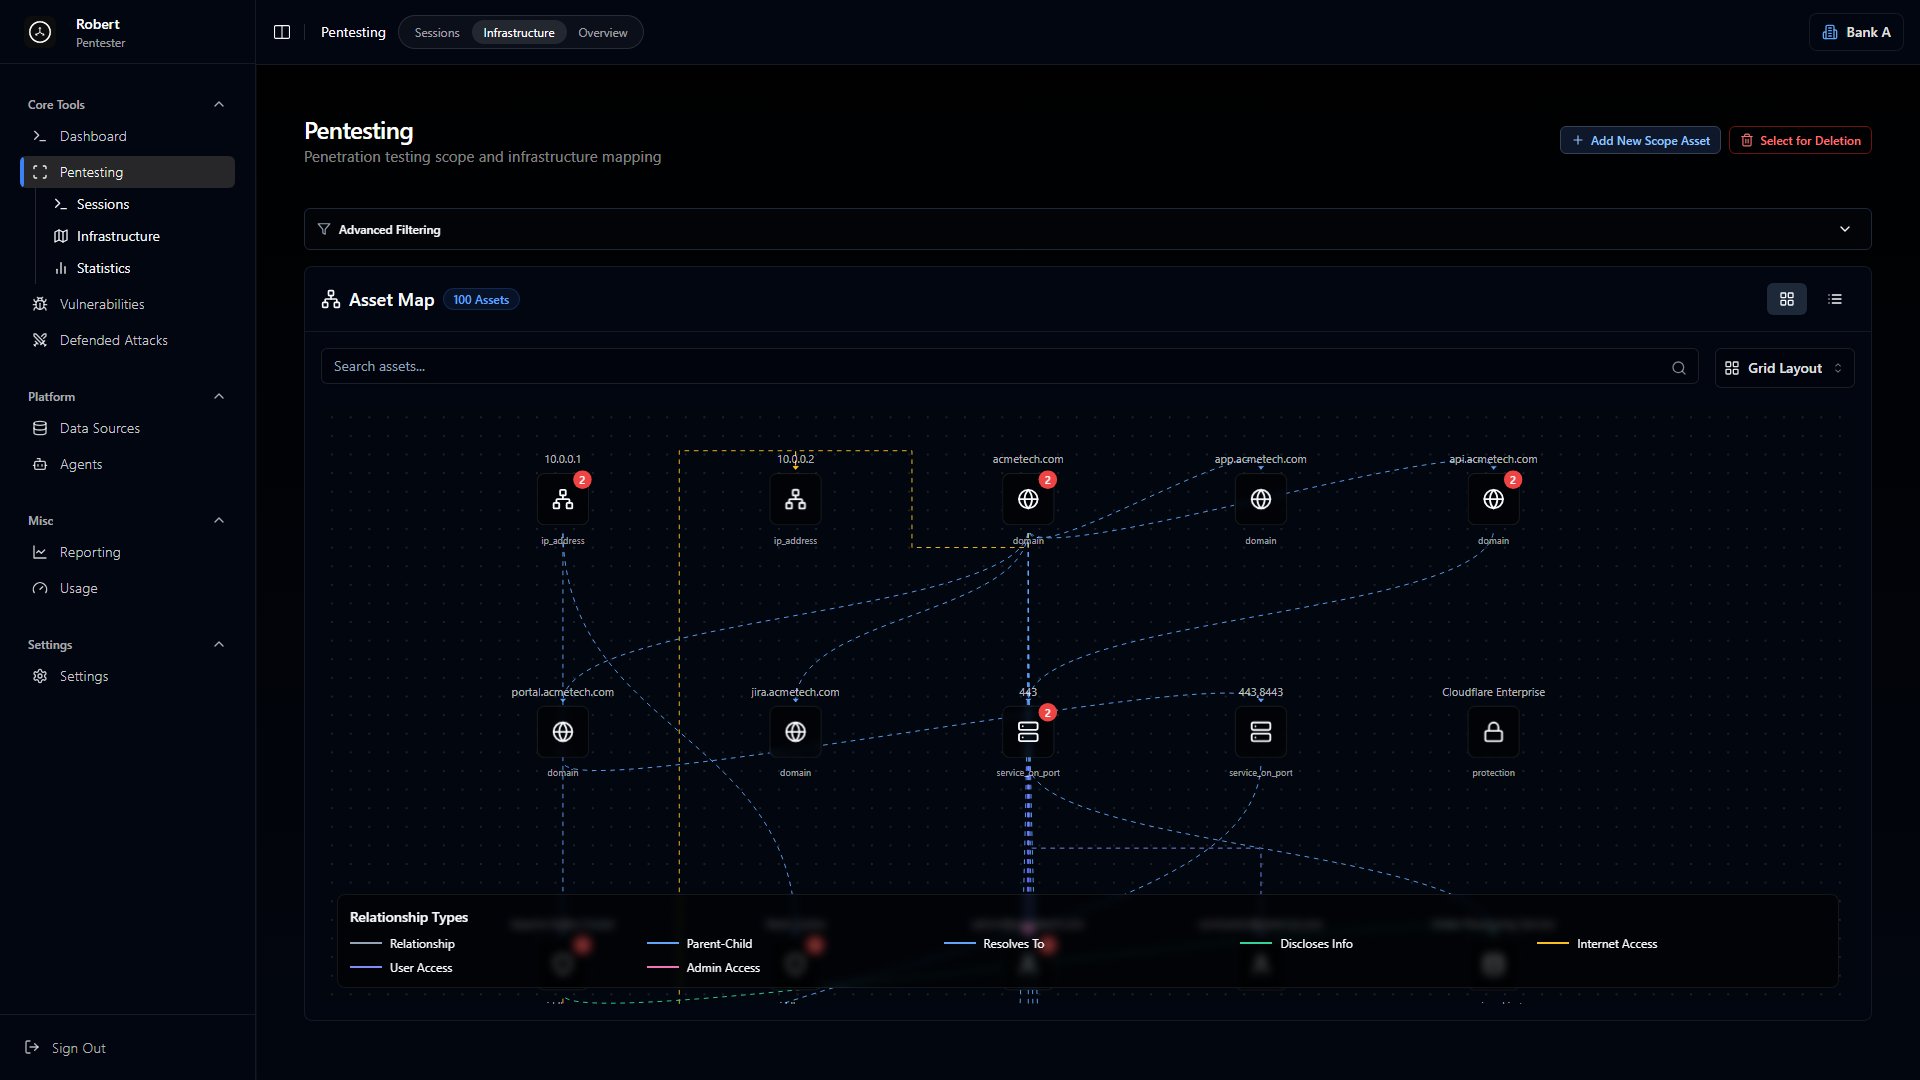
- Domains (e.g.,
example.com) - IP addresses (e.g.,
10.0.0.1) - Services (e.g.,
http,https,ssh,ftp) - People (e.g., security analyst, developer) - they can be targets of social engineering attacks
- Objects (e.g., files, API endpoints, subfolders)
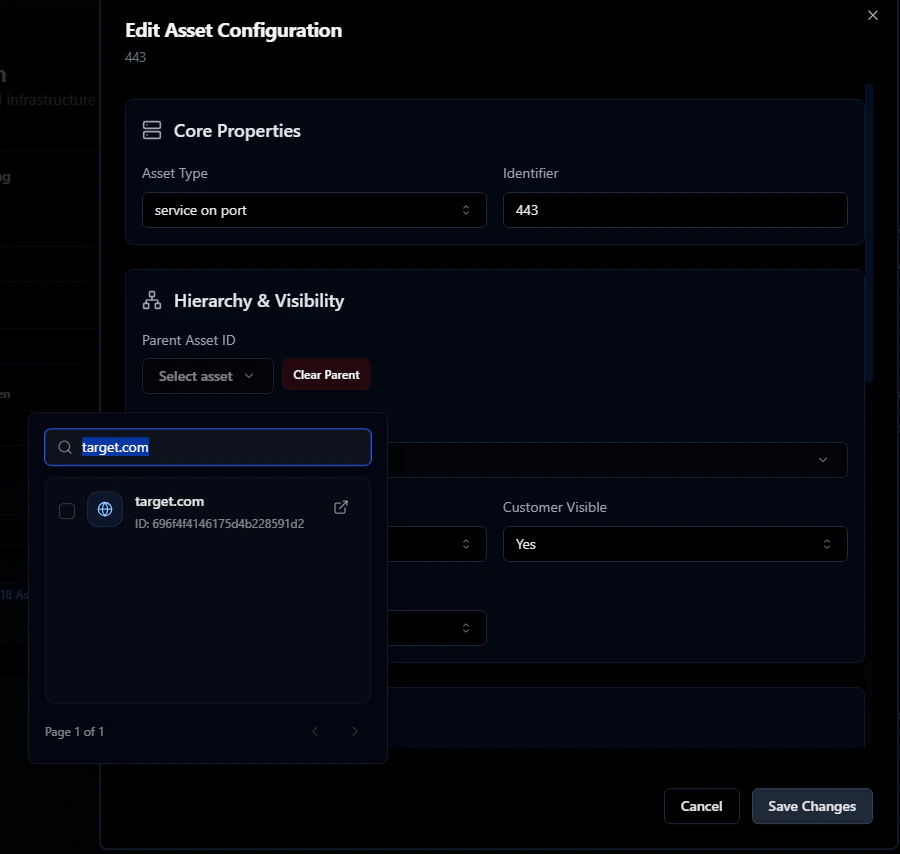
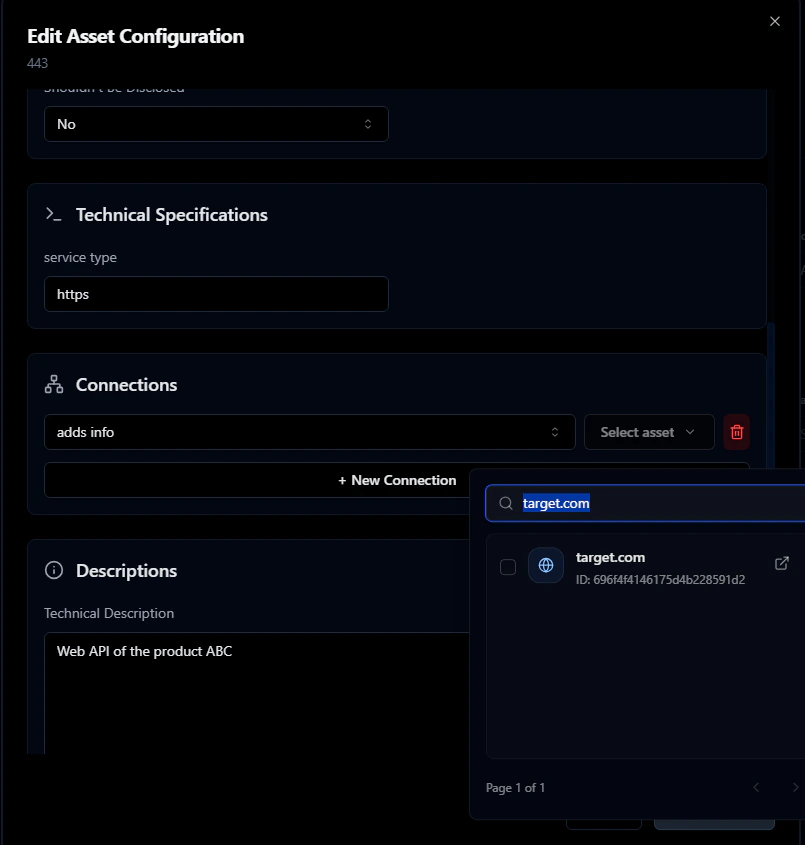
target.com and an HTTP service on port 443. Start with the domain:
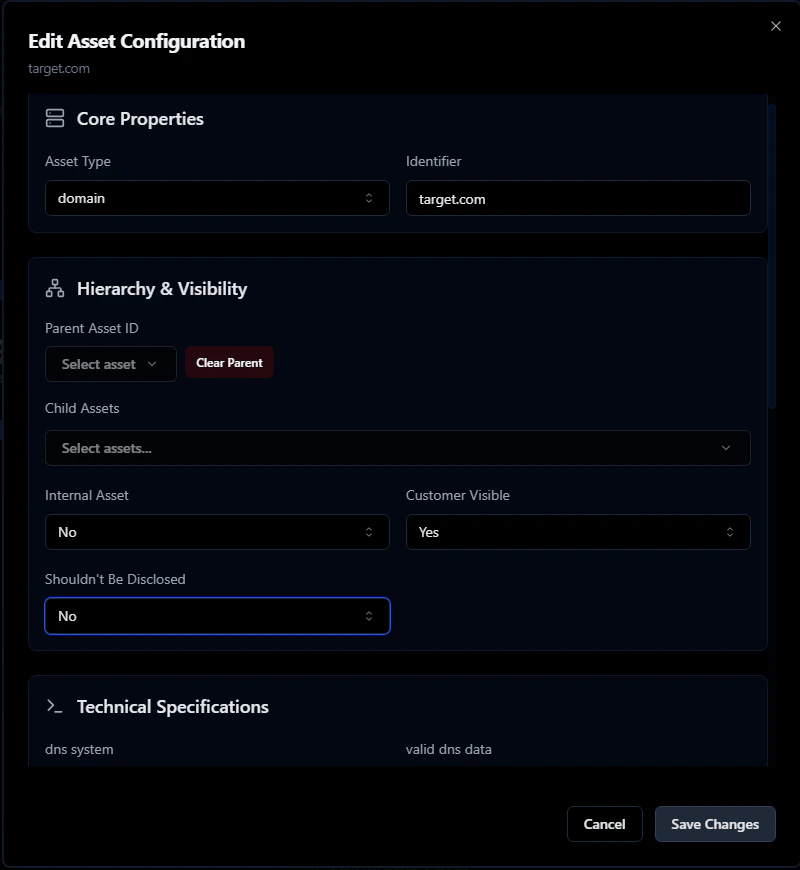
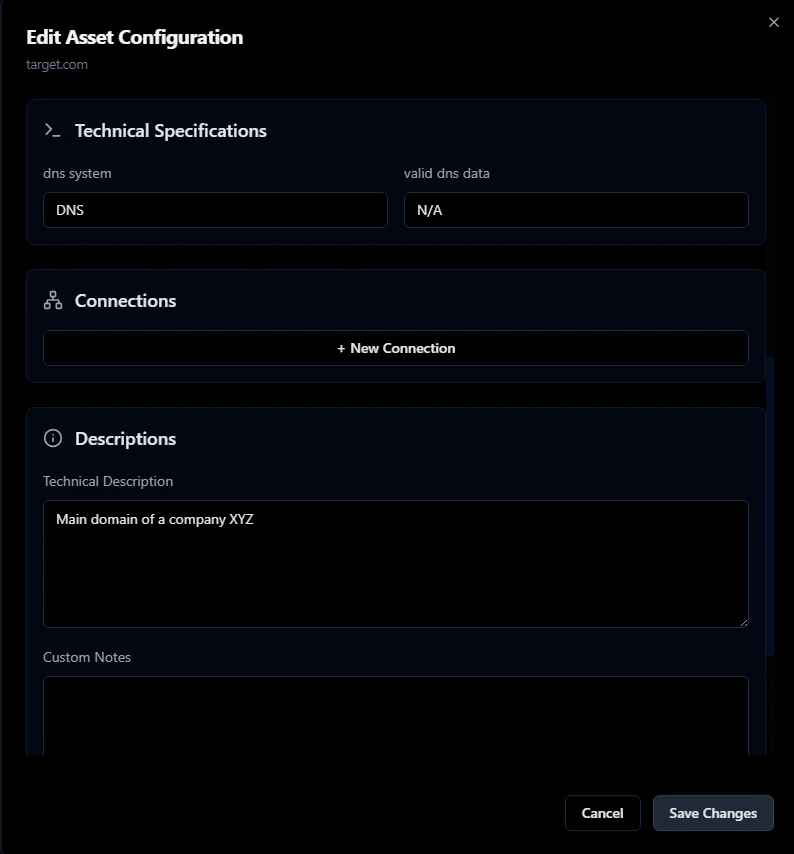
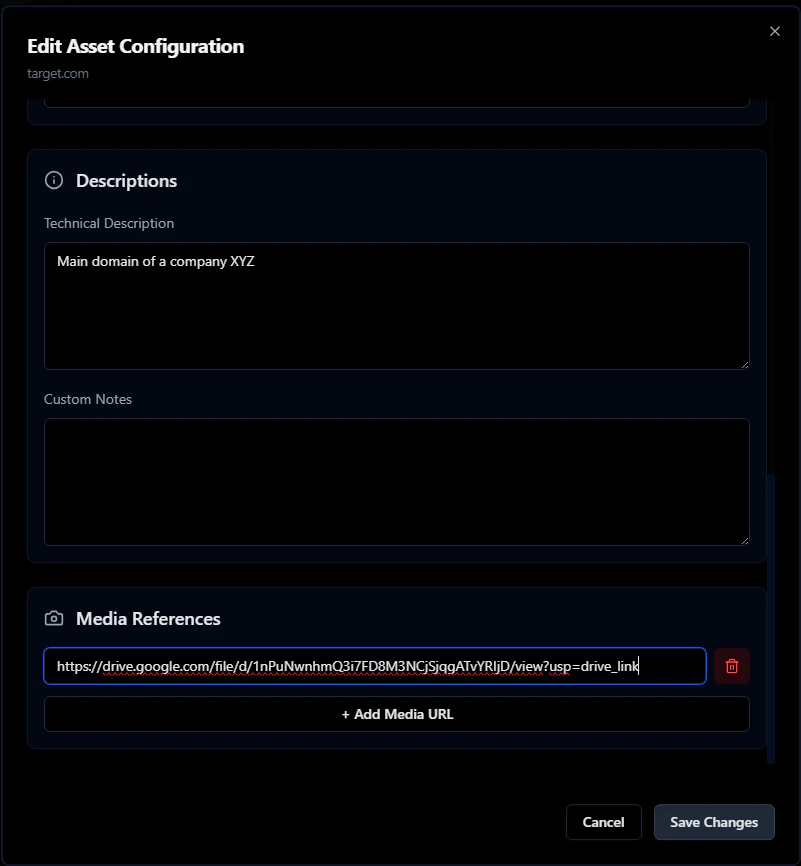
target.com as the parent - this links the service to its domain.
Sessions
The Sessions tab is the IDE - where you work with AutoPT and Codegen to run code against your targets.